Table of Contents
Chronostratigraphy - Geological Time Scales
Chronostratigraphy is the process by which geological time is divided up into meaningful “chunks” of named units. This is hierarchical with categories such as Eons, Eras, Periods, Epochs and Ages/Stages… together with various “Sub-” categories as well. Thanks to Mr. Spielberg and a rather confused Tyrannosaurus rex* (which didn't even live during the Jurassic) almost everybody has heard of the Jurassic Period. But the Jurassic is but one of three Periods that make up the Mesozoic Era which itself is but one of three Eras that make up the Phanerozoic Eon.
(* strictly speaking - if you have been following the notes on Taxonomy - Tyrannosaurus rex Osborn, 1905)
Going in the other direction hierarchically, in the Middle Jurassic Epoch, the Bajocian Stage is subdivided into Late, Middle and Early Substages but in New Zealand (for example) there is an interval within the Middle Bajocian called the middle Temaikan.
The latest addition to the lexicon is the “Anthropocene”, beloved of many modern geologists and, especially, environmentalists. At present, this term is not formally defined as scientists are still debating just exactly how to recognise it. However, when it becomes officially accepted it will become the latest Epoch of the Quaternary Period and the latest Epoch in Earth History.
Although there are many terms, each with their own typically hard-to-remember name, chronostratigraphic units are convenient “blocks” of geological time to enable geologists to communicate with one another about the rocks they see in their back yards.
In the 21st century after over 200 years of mulling over the issues. it may come as a surprise to many geologists, that many of the chronostratigraphic (e.g. Stage) names in which we place so much emphasis (e.g. Aptian, Visean, Miocene etc.) still lack a formal definition. The reason for this is… historical… in all senses of the word.
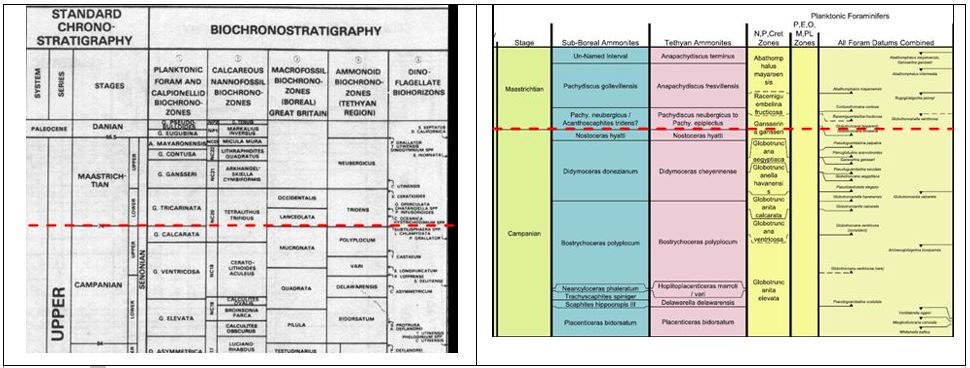
Similarly, even some stages which were once thought to be well-known, understood and “stable” in the hierarchy have been redefined and, in many cases, now occupy positions quite different to what they were in the past. For example, relatively recent changes in the position of the Maastrichtian – Campanian boundary (which has jumped 2 ammonite zones and three planktonic foram zones!) have rendered many publications and industry reports misleading due to references to sections of “Early Maastrichtian” age which are now more correctly “Late Campanian”.

The change in position of the Campanian-Maastrichtian boundary over a ten-year period compared to standard biozones. The boundary is now almost 4 million years younger than it was previously considered to be!
By reason of the availability of the rock sections to early students of stratigraphy, most chronostratigraphic stages were first defined in platform settings where major faunal and floral turnovers tended to occur - “the expression of the boundaries which Nature has drawn with bold strokes across the whole globe” (d’Orbigny, 1842 as quoted in an English translation). Such settings are, of course, not ideal when defining global stratotypes as, when such sections are stacked one above the other, there is much of geological time that goes unrepresented as evidenced by the very unconformities used to define the boundaries.
It is clear that the bases of such stages (for it is stage bases that are formally defined given that their tops are consequently defined by the base of the overlying stage) should be established in more basinal settings where deposition is likely to have been more continuous. See Simmons et al. (2007) for a review on these and other chronostratigraphic concepts.
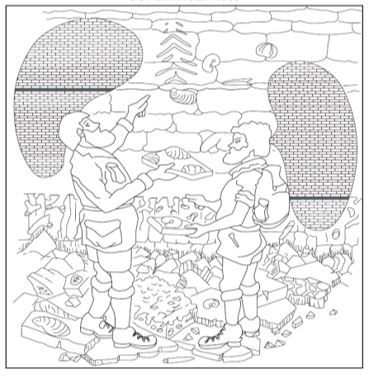
Likewise, the position of a boundary may be variable depending on the kinds of fossils and other geological signals used to define them. For example, those who study terrestrial fossils (mammals, dinosaurs, plants etc.) often see major changes at different levels than those who study marine fossils (ammonites, trilobites, foraminifera etc.) because different types of organisms respond differently to environmental changes imposed upon them. Therefore, for example, the same “Early Aptian” succession to one geologist may be called “Late Barremian” by another (see figure below).

Two geologists arguing over the placement of a chronostratigraphic boundary (thick black line). The dispute arises because each geologist is studying a different type of fossil which may be responding to different environmental/evolutionary pressures acting at different times. In theory, the rock layers between the two black lines could be assigned two different ages!
Despite all the work of many geologists in the 18th, 19th and the bulk of the 20th centuries, the first concerted, collaborative attempt to provide a global standard chronstratigraphic time scale did not occur until Harland et al. (1990), with subsequent new techniques and refinements in Gradstein et al. (2004) and subsequent publications.
Somewhat disbelievingly there are currently fourteen proposed separate datums (based on magnetostratigraphy and biostratigraphy) to define the boundary between the Jurassic and Cretaceous Periods (Gradstein et al., 2012). All other Period boundaries have been defined. Eight years later (Gradstein et al., 2020), although a formal proposal has been put forward, this was still “under consideration” by the International Commission on Stratigraphy.
Why Does This Matter?
For practical purposes, the use of stage names and their derivatives – chronostratigraphy – as correlation tools is inherently problematic. For example, as the example at the top shows, correlating a Late Campanian section in one well with a Late Campanian section in another would be incorrect if the two wells were drilled in the 1990s and the 2000s. Conversely sections from two wells designated as Early Maastrichtian and Late Campanian respectively would not be correlated yet those two intervals would in fact be contemporary. The chronostratigraphic ages assigned to stratigraphic intervals in wells and outcrops are convenient, but they are only labels assigned by us based on current opinions.
Put another way, ages are interpretations and, as we know, interpretations can and do change. This is frustrating for geoscientists of course – it seems that “the oracles are giving conflicting methods or changing their mind!” (Simmons, 2016). When geologists ask the relatively simple question “what age is that outcrop/formation/log pick/seismic marker?” they normally expect a relatively simple answer – “it’s Early Cretaceous” or “it’s upper Bajocian”.
This simple answer is, in fact, a shorthand or an interpretation of what is in reality a much more complex answer. For example, the technically correct answer might be…
“It contains an assemblage of dinoflagellate fossils indicative of the Nannoceratopsis semex biozone which in turn is currently calibrated with the Strenoceras niortense to Parkinsonia parkinsoni Tethyan ammonite biozones which currently form the standard biozones of the upper half of the Bajocian stage within the Jurassic system.”
Even this answer has (to paraphrase a recent US secretary of State) “certain uncertainties”! For instance, how certain was the original interpreter that those marker species really were indicative of the Nannoceratopsis semex biozone?!
We have also not yet discussed the seemingly ever-changing numerical ages attached to stratigraphic units, their boundaries and events taking place within them and how any why a particular event (like the Campanian-Maastrichtian boundary above) can suddenly become instantly older or younger at the drop of a Potassium-Argon radiometrically-dated hat.
The whole process, as can be imagined, is fraught with ifs, buts and maybes and it is not surprising that many geoscientists express frustration and bewilderment whenever new data appears which seems to contradict (or at least adjust) our previous, lovingly constructed charts and diagrams.
Respectfully, we must remind geoscientists that, like it or not, this is how science works and it is the progressive refinement of things we already know that helps us to improve accuracy and precision which in turn impacts on how we view certainty and risk-reduction in petroleum geology.
On the positive side we can think of our question… “what age is this?” in another way. It is, in fact, an oblique way of asking the question we really want to know which is “does this rock correlate with this other rock?”. This is actually a much easier question to answer, as subdivision (of rock) and thence correlation of those rocks on the basis of, for example, their fossil content at a local, regional or global scale is often a more straightforward notion than the age label that usually accompanies this (Simmons, 2016). So how do we do it?…
Working The Problem
Rather than rely on interpretations in the form of age labels, it is far better to use recognisable and real objects in the rocks themselves, such as fossils, by which to correlate separate rock sections. Long-term studies in deep-water sections where deposition has been relatively uninterrupted have resulted in an established sequence of recognisable fossil events which in turn has led to the establishment of numerous zonation schemes. These deep-water schemes tend to have a more global breadth of application because they utilise fossils which are predominantly free-swimming or floating and which therefore have the potential to colonise most of the marine environments on Earth. These “global standard schemes” have been compared, contrasted and calibrated against similar rock sections deposited in more proximal, local areas which may have more depositional breaks, on the basis of some fossils which are common to both types.
This task is enabled by the practice of using biozones – intervals defined by discrete, easily identifiable fossil events which occur in the same order across numerous sections within a basin or region. The consistency of the defining events ensures consistency of correlation between biozones irrespective of the age-label placed upon it. This is the essence of biostratigraphy.
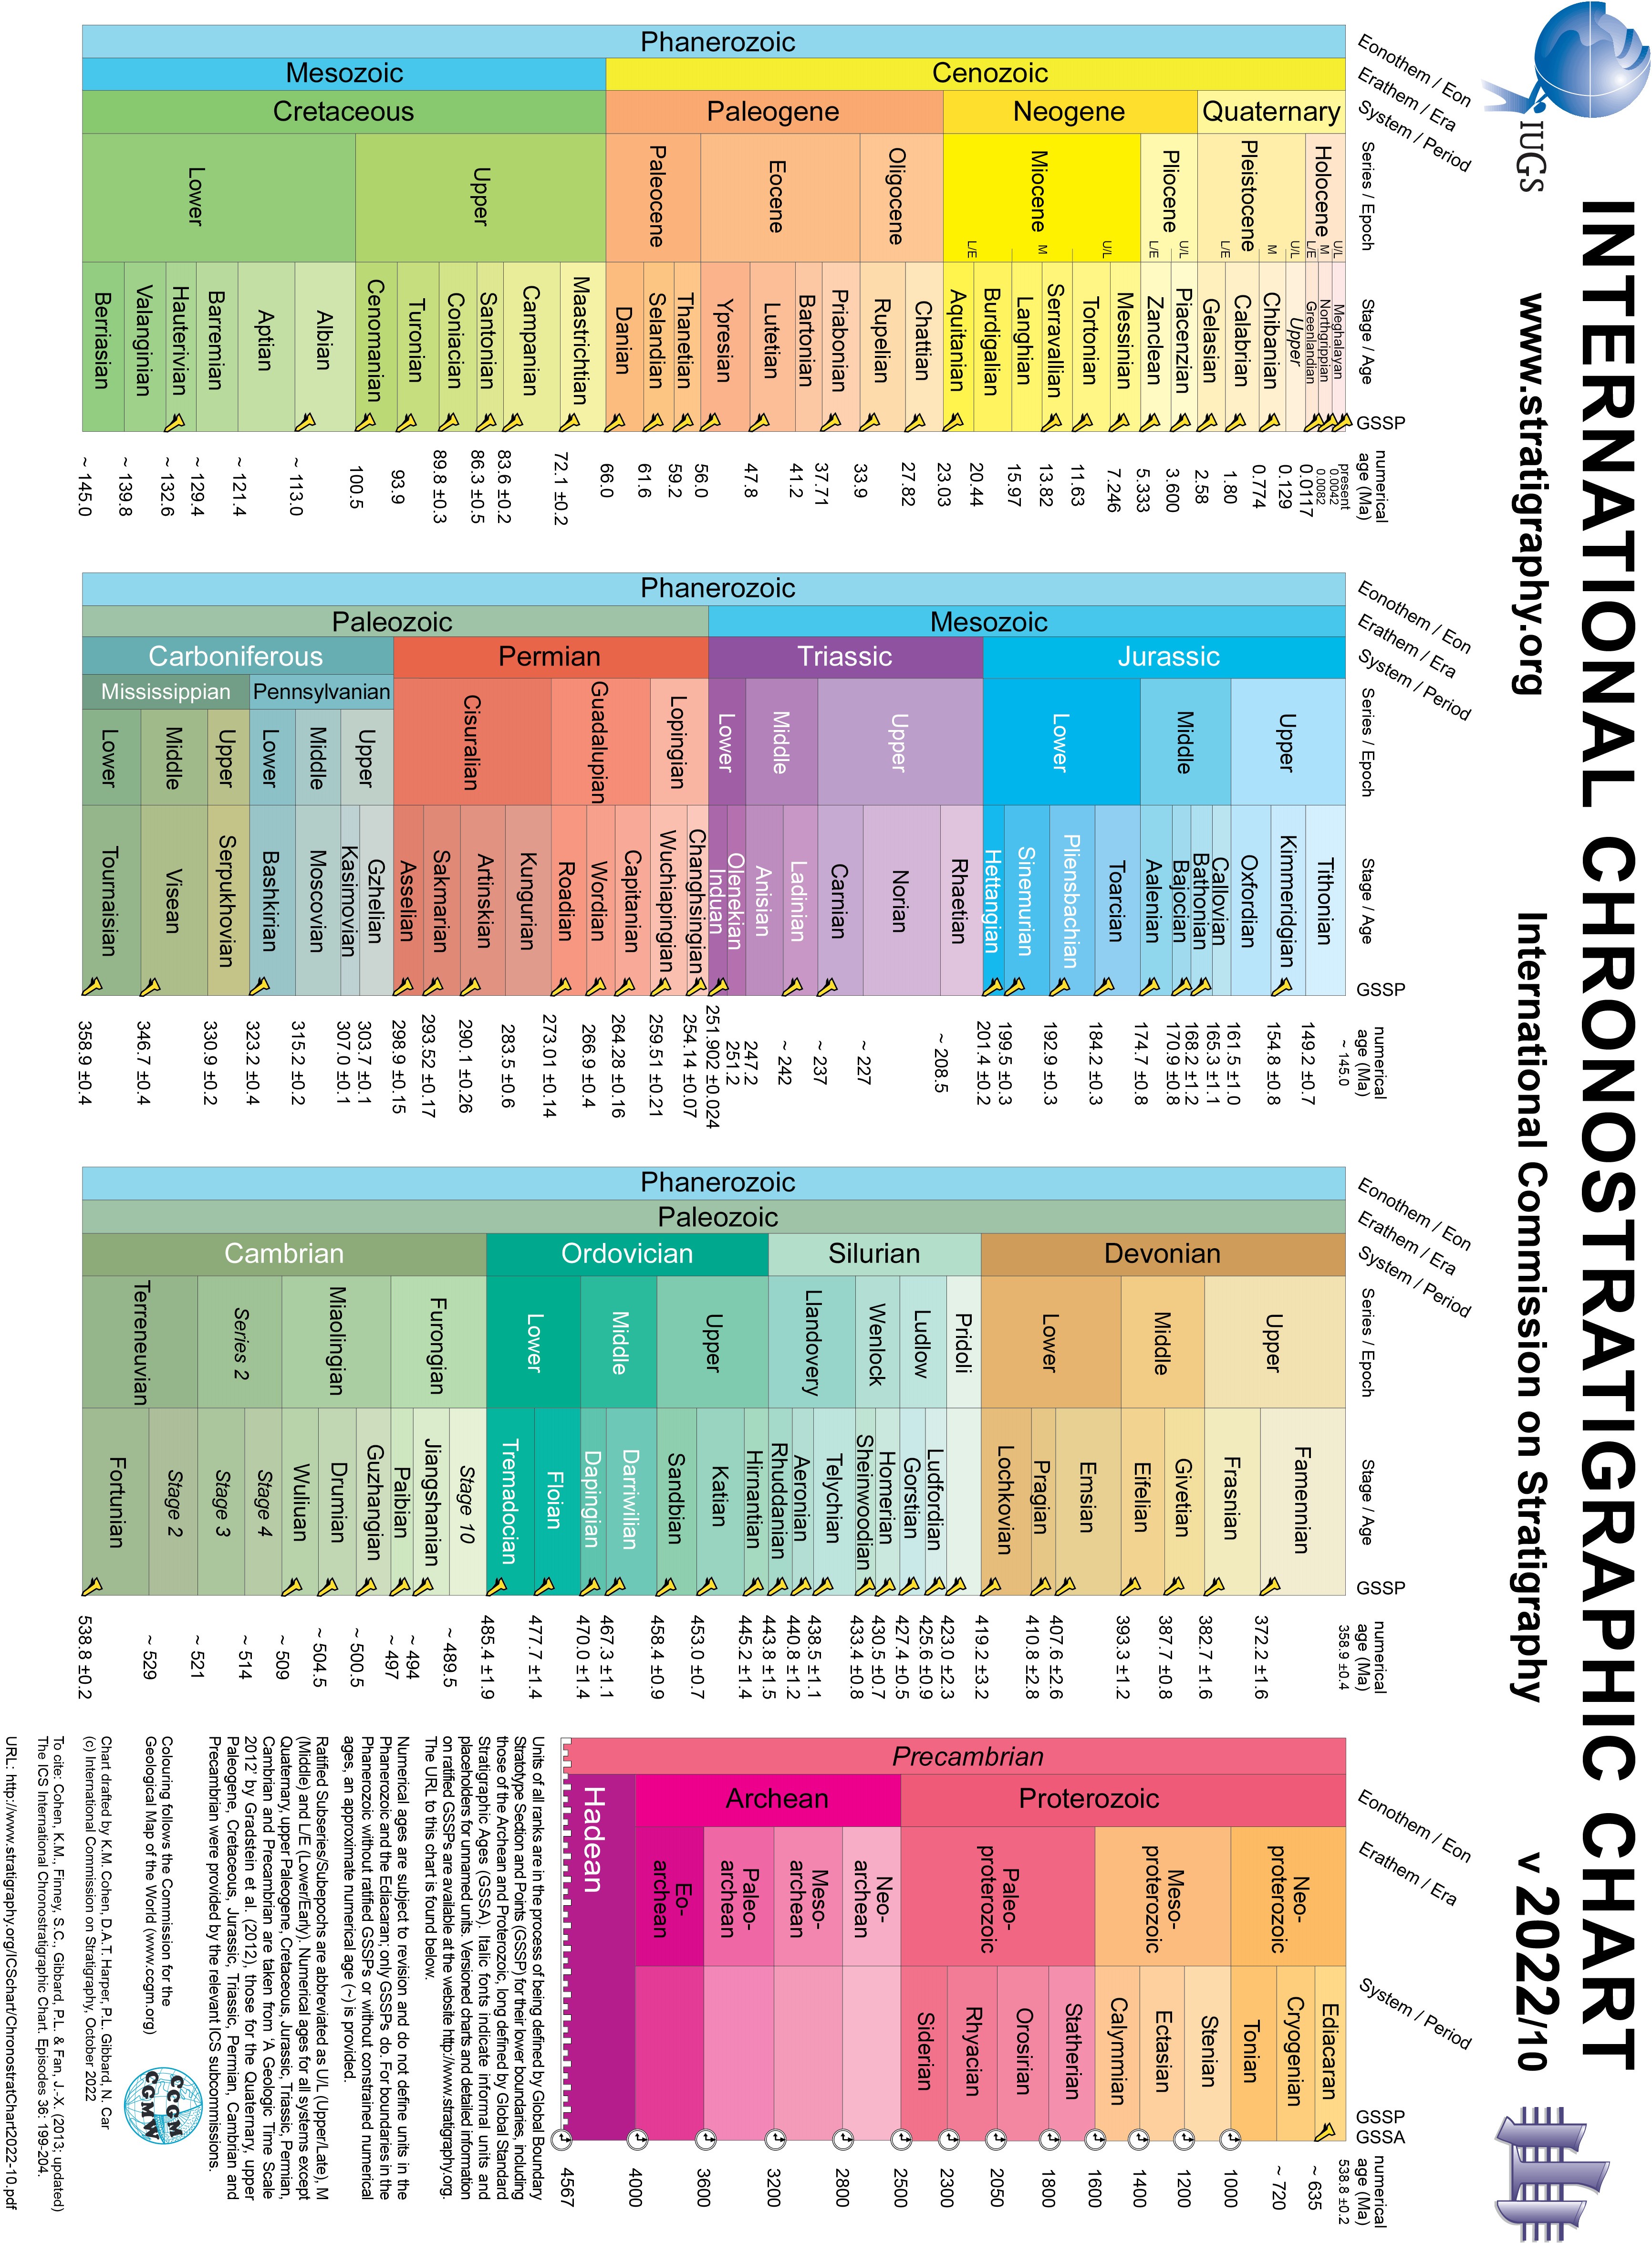
Global chronstratigraphic time scale as used in this manual (after Gradstein et al., 2020 et seq. used with permission and thanks). Formally agreed GSSPs are shown and some important stage boundaries remain as yet undefined.
Cohen, K.M., Harper, D.A.T., Gibbard, P.L. 2023. ICS International Chronostratigraphic Chart 2022/10. International Commission on Stratigraphy, IUGS. https://www.stratigraphy.org (visited: 2023/03/19)
