Table of Contents
Why Is Sequence Stratigraphy Important?
Sequence Stratigraphy is a way of classifying and arranging sediments based on the relative position of sea level at the time of deposition. Because global eustatic sea level change is cyclic, it is predictable, therefore the distribution of sediments thus deposited are likewise predictable.
Systems Tracts are a series of linked contemporaneous depositional systems with all sediments deposited subject to a constant regime of relative sea level. Systems Tracks build the rock record, Sequence Surfaces are used to correlate it.
The predictive nature of the subject affords great potential for exploration and appraisal because it increases confidence on what may lie in areas without direct data availability. In simplistic terms, during sea-levels falls landscapes are exhumed and eroded. The products of erosion have to go somewhere - where? Sequence modelling gives us insights where the depositional systems are, how far they extend and the channelling involved and therefore we can predict where the products of erosion (usually expressed by the development of submarine far sands - potentially very good reservoirs) will occur. In summary:
- Sequence Stratigraphy allows synchronous events to be correlated through multiple data sets.
- It relies on the analysis of changes in depositional facies and geometry of strata and the identification of key surfaces which allows the chronological order of basin filling and erosional events to be determined.
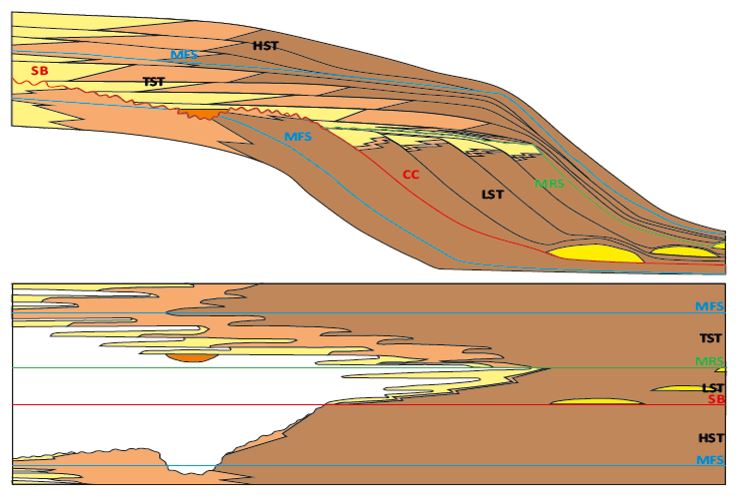
- Sediments are classified into packages based on the regime of relative sea level they were deposited under (see figure below), rather than relying on lithostratigraphic terms to classify sediments.
- Sequence stratigraphy greatly enhances the ability to accurately predict sediments outside of data control – important for prediction of Source, Reservoir and Seal facies.

Schematic view of a sequence in a clastic environment. The figure at the top is drawn according to rock thickness. Sediments are grouped together in packages (“systems tracts”) deposited during phases of sea-level cyclicity, separated by different sequence surfaces. The lower image shows the same packages and surfaces, this time drawn according to the (upwards) passage of time. Such images form the basis for Chronostratigraphic Charts.
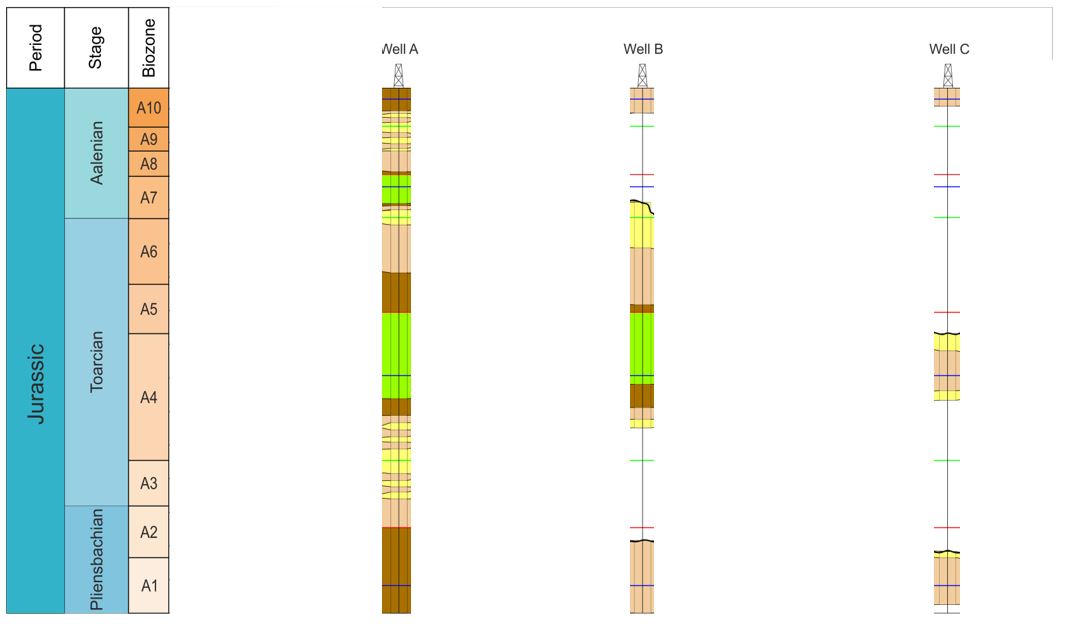
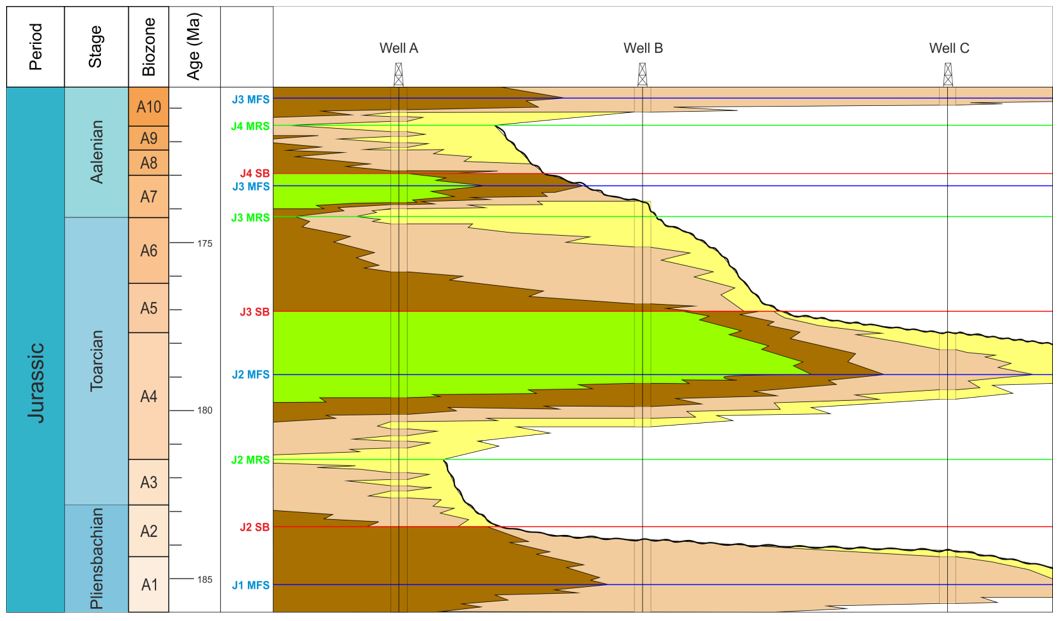
The predictive power of sequence stratigraphy enables sedimentary packages to be correlated between sections in terms of their position within a typical cycle of sea level fall and rise. It therefore becomes possible to predict what likely sediments are to be found outside areas of data control:

Facies from separate lateral sections (upper image: green - organic rich deep water sediments; dark brown - deep water fine clastics; light brown - shallow water fine clastics; yellow - shallow water coarse clastics) can be interpreted in terms of “systems tracts” and can in turn be correlated by the sequence surfaces which separate them vertically. In practice the surfaces are usually identified and correlated first with the systems tracts interpreted between them. We can use sequence stratigraphic models to predict what sorts of facies in the same systems tracts (which can also include the deposition of no facies at all) might occur in areas between data points (lower image). Such diagrams (below) are called Chronostratigraphic Charts which form the basis for regional screening and play identification.


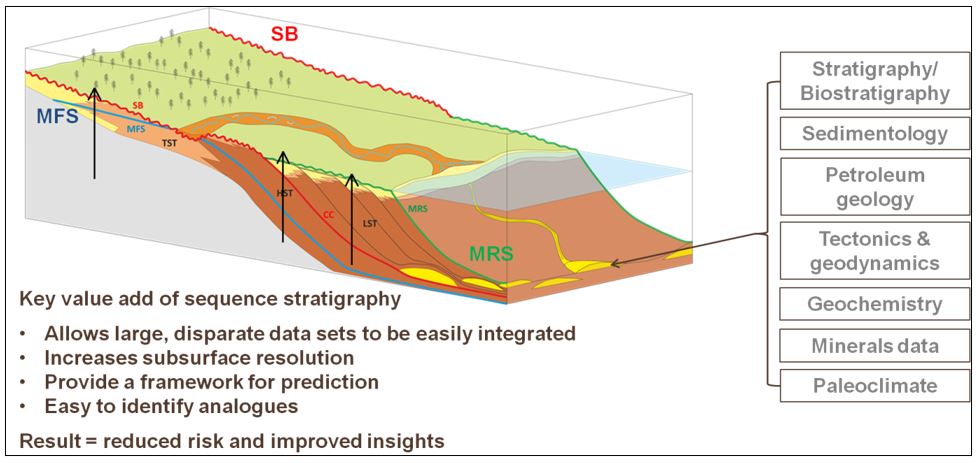
Advantages of sequence stratigraphy.